Journal of Neuroscience Methods
, July 2019
Automated segmentation of brain cells for clonal analyses in fluorescence microscopy images
Massimo Salvi 1 , Valentina Cerrato 2 , Annalisa Buffo 2 , Filippo Molinari 1
The understanding of how cell diversity within and across distinct brain regions is ontogenetically achieved is a pivotal topic in neuroscience . Clonal analyses based on multicolor cell labeling represent a powerful tool to tackle this issue and disclose lineage relationships, but produce enormous sets of fluorescence images, leading to time consuming analyses that may be biased by the operator’s subjectivity. Thus, time-efficient automated software are needed to analyze images easily, accurately and without subjective bias.
In this paper, we present a fully automated method, named FAST (‘Fluorescent cell Analysis Segmentation Tool’), for the segmentation of neural cells labeled by multicolor combinations of fluorophores and for their classification into clones. The proposed method was tested on 77 high-magnification fluorescence images of adult mouse cerebellar tissues acquired using a confocal microscope. Automatic results were compared with manual annotations and two open-source software designed for cell detection in microscopic imaging. The algorithm showed very good performance in the cellular detection and in the assignment of the clonal identity.
To the best of our knowledge, FAST is the first fully automated technique for the analysis of cellular clones based on combinatorial expression of fluorescent proteins. The proposed approach allows to perform clonal analyses easily, accurately and objectively, overcoming those biases and errors that may result from manual annotations. Moreover, it can be broadly applied to the quantification and colocalization within cells of fluorescent markers, therefore representing a versatile and powerful tool for automated quantitative analyses in fluorescence microscopy.
1
Biolab, Department of Electronics and Telecommunications, Politecnico di Torino, Turin, Italy
2
Department of Neuroscience Rita Levi-Montalcini, University of Turin and Neuroscience Institute Cavalieri Ottolenghi, Orbassano, Turin, Italy
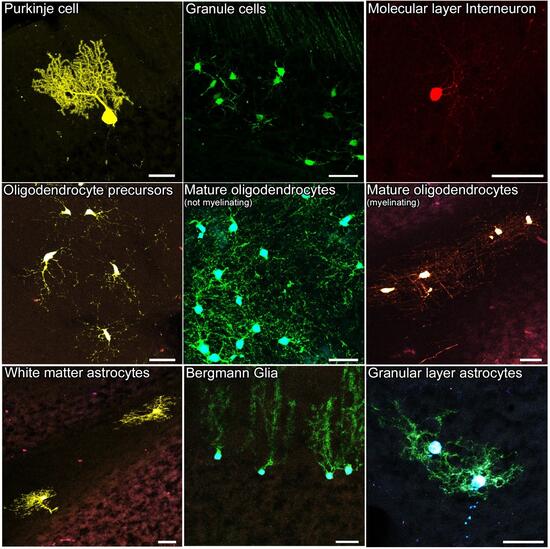
Representative images of the distinct cell types analyzed.
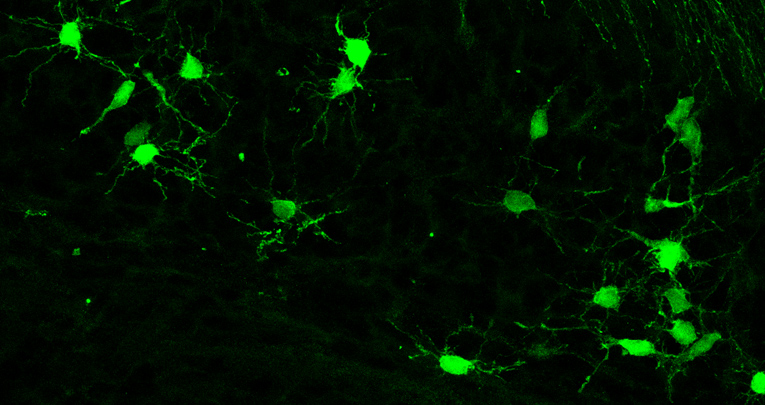
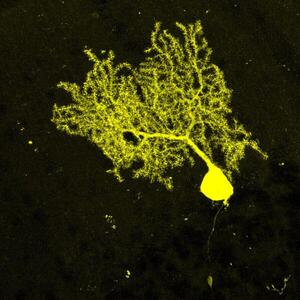
The dataset contained images of diverse cerebellar cell types, clearly distinguishable according to their morphology and localization within the tissue. These cells comprised either neurons, such as Purkinje cells (a) and Granule cells (b), or interneurons (c), or glial cells (d–i). Glial cells included oli- godendrocytes at distinct stages of maturation,i.e. precursors (d), mature not-myelinating (e) and mature myelinating oligodendrocytes (f), and the three main cerebellar astrocyte types, comprising white matter astrocytes (g), gran- ular layer astrocytes (h) and Bergmann glia (i). Scale bars: 30 μm.


